How AI can improve the economics of the mobile network.
Telecom operators need to fund growing demand for connectivity from a business with limited revenue growth. Dell’Oro’s 2026 outlook puts global carrier revenue growth at approximately 2% a year. In Europe, mobile ARPU adjusted by GDP fell 2.4% in 2024 to €14.9, while mobile traffic increased from 149 exabytes in 2024 to 169 exabytes in 2025. Operators must carry more data, maintain service quality and finance the next technology cycle without a matching increase in revenue per customer. [1, 3]
The investment commitment is substantial. MTN Consulting’s September 2026 tracker of 145 operators puts annualised telecom capital expenditure at $304.5 billion through the second quarter. Debt servicing competes with that investment for cash. Vodafone alone reported €38.6 billion of gross debt at March 2026; its annual bond interest expense rose from €1.30 billion to €1.42 billion. Refinancing maturing debt at higher rates adds to this financing burden, tightening the funds available for network renewal and AI. [2, 4, 21]
The network sits at the centre of these economics. MTN Consulting’s 2025 study of 32 operators found that network-related expenditure accounted for 50.8% of total operating costs in 2023, covering operations, leasing, utilities and depreciation. Network operations alone represented 18.4%. Improving how the network is built, used and maintained therefore addresses a major part of the operator’s cost base, as well as the infrastructure on which its customer experience and revenue depend. [19]
Within the mobile network, the radio access network is the largest infrastructure cost component. GSMA’s 5G-era cost model places RAN infrastructure at 45–50% of mobile-network total cost of ownership, spanning towers, site equipment, radios and baseband processing. Its economic importance extends well beyond electricity: operators must deploy, lease, upgrade and maintain this distributed estate while keeping enough capacity available for peak demand. GSMA Intelligence also attributes 75–80% of mobile-network energy consumption to the RAN, including site infrastructure and backhaul transport. [5, 20]
Why the RAN. This concentration of infrastructure, operating cost and customer impact makes the RAN a priority for AI investment: reducing the cost of delivery, improving the service and creating capacity for additional revenue.
Why programmable networks and better AI change the opportunity
At a busy station, the network needs to carry more traffic without allowing service quality to deteriorate. Overnight, it should reduce resource use where demand permits. When a neighbouring cell fails, it must reconsider both decisions. The commercial objective is to make capacity and availability follow demand while protecting service commitments, using the lowest sustainable cost base and creating room for additional revenue.
AI can help because these decisions depend on changing, interacting conditions that fixed rules cannot always anticipate. Better prediction and task-specific models can make optimisation more responsive, while software-controlled network functions provide ways to act on the result. The opportunity comes from connecting these capabilities: predict demand and network conditions, choose an action, execute it through supported software controls and measure the result.
There are already useful demonstrations of the value. O2 and Nokia reported approximately 20% better spectral efficiency in a live Paddington trial in October 2026, alongside improved throughput under high demand. Deutsche Telekom reports that its production RAN Guardian reduced a defined event-management workflow from hours to roughly one minute and executed more than 100 autonomous remediation actions in its first month. Together, these examples show AI improving both the productivity of network assets and the speed of network operations. [6, 7]
The three AI-RAN categories describe different investment cases
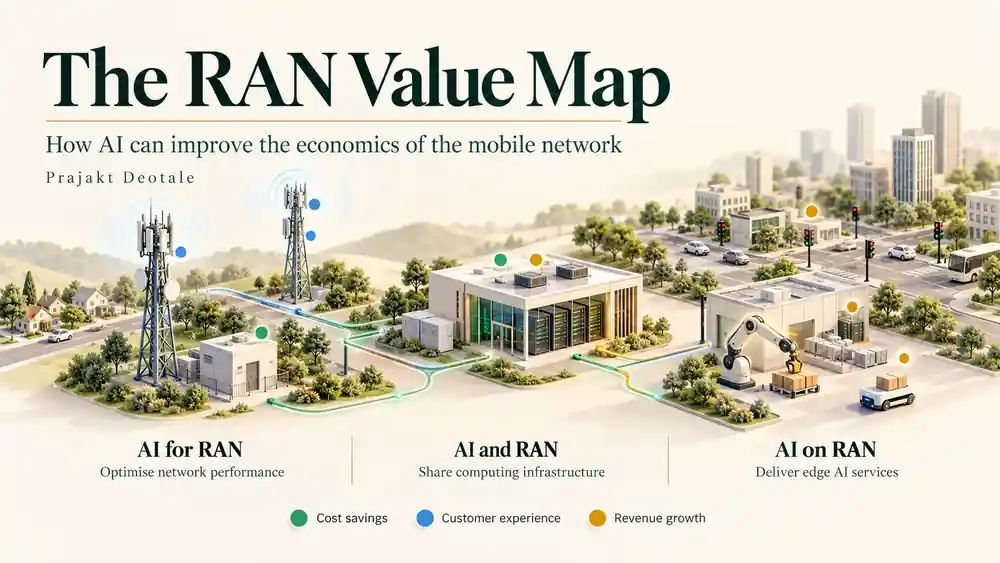
The AI-RAN Alliance distinguishes three areas. AI-for-RAN improves radio performance and network operation, including energy, scheduling, mobility and assurance. AI-and-RAN shares infrastructure between RAN functions and other AI workloads, potentially including GPU-as-a-service. AI-on-RAN brings AI applications to the network edge, where proximity or integration with connectivity can benefit the customer. Each opens a different route to value from the network and its infrastructure. [8]
The map below locates six opportunities across these categories. Green marks potential cost savings, blue marks customer experience and amber marks revenue contribution. A hotspot can carry more than one colour, but the business case must explain how those benefits interact. Improved throughput is valuable operationally; it becomes financial value only when it changes an investment decision, a service outcome or a sale.
The evidence test. The case for renewed investment rests on measurable improvements in decisions and delivery. Faster or cheaper AI is an enabler; the operating result is the evidence.
Mapping AI opportunities across the RAN
A logical topology with six AI opportunity hotspots. Green identifies cost savings, blue customer experience and amber revenue contribution.

RU = radio unit; DU = distributed unit; CU = central unit; UPF = user-plane function. Solid lines show illustrative connectivity; dashed lines show control, coordination or hosting associations. Logical functions and physical hosting are distinct. [8, 17]
Where value appears at the radio and site
1. Site energy
75–80% · Cost savings
75–80% of mobile-network energy is attributed to RAN, including site infrastructure and backhaul. Energy represents roughly 15–20% of operator opex in the same GSMA Intelligence analysis. [5]
AI forecasts demand, sleeps eligible resources and wakes them before service deteriorates. TDC NET and Ericsson report about 5% lower energy per GB and approximately 800 MWh saved in 2024 within their project scope. [9]
Value test. Measure metered kWh avoided at comparable traffic and service conditions, apply the relevant tariff and subtract implementation costs.
2. Radio capacity
~20% · Cost savings, customer experience, revenue
Approximately 20% better spectral efficiency was reported by O2 and Nokia in the live Paddington trial. SoftBank and Ericsson separately reported average gains of approximately 10% in spectral efficiency and downlink throughput across evaluated locations. [6, 10]
AI improves scheduling and link adaptation at constrained locations. The business benefit comes from serving more demand with existing spectrum and infrastructure, or deferring a specific capacity upgrade.
Value test. Identify the investment decision or additional sale changed by the gain. Value the affected capacity, rather than applying the trial percentage to the whole RAN budget.
3. Cell coordination
Up to 95% · Customer experience, cost savings
Up to 95% coverage-prediction accuracy was reported in Optus and Ericsson tests across frequencies. Separately, GSMA found nearly one in five surveyed 5G users dissatisfied, with speed and coverage the leading reasons. [11, 12]
AI combines demand and radio measurements to improve mobility settings and balance load across cells. Prediction accuracy establishes a technical capability; the operating objective is fewer failed handovers and interrupted sessions.
Value test. Measure the entire cell cluster, including congestion and signalling. Connect service improvements to fewer complaints or lower churn using the operator’s customer and incident data.
Where value appears in operations and services
4. Service assurance operations
Hours to ~1 minute · Cost savings, customer experience
Hours reduced to approximately one minute is Deutsche Telekom’s reported improvement in a defined event-management workflow. Its production RAN Guardian also executed more than 100 autonomous remediation actions in its first month. [7]
AI forecasts events, correlates symptoms, diagnoses likely causes and executes approved remedies. The addressable value includes handling effort, site visits, restoration time and customer-impact minutes.
Value test. Combine verified avoided visits and service credits with workflow effort released. Count cash savings when spending falls, and report released engineering capacity separately.
5. Shared computing
20 cells · Cost savings, revenue
20 cells on one AITRAS server were demonstrated by SoftBank alongside AI and robotics workloads, with 100 devices streaming video. The radio configuration used 100 MHz and 4T4R. [13]
AI and RAN can share infrastructure, with radio reservations protected and remaining capacity assigned to internal AI or paying tenants. Singtel RE:AI’s GPU and model services illustrate the adjacent sovereign AI business, including enterprise model hosting. [15, 25]
Value test. Compare combined RAN and AI delivery costs with separate systems. Revenue depends on sellable capacity after radio reservations, realised prices and the full cost of hosting and support.
6. Edge AI services
Robot-to-edge inference · Revenue, customer experience
Robot-to-edge inference offloading was demonstrated by SoftBank and Ericsson in February 2026, combining AI-RAN computing with prioritised connectivity. SoftBank also announced a GPU cloud incorporating Inference as a Service, with an October 2026 launch schedule. [23, 24]
Bundle connectivity, compute and managed inference for robot fleets, industrial inspection or local video analytics. The proposition is an application outcome with a clear reason to run nearby.
Value test. Measure contribution per paying deployment after infrastructure, software, integration and support costs, alongside the customer’s task completion, responsiveness and reliability.
How AI changes network decisions and infrastructure economics
Energy management, load balancing and mobility optimisation already have established engineering baselines. The new opportunity is to learn local patterns, improve predictions and act through supported software controls. SoftBank and Ericsson’s link-adaptation trial and Optus and Ericsson’s cell-specific coverage prediction show where this can improve decisions on existing networks. [10, 11]
Worked example of improving handovers between cells
As a train arrives at a busy station, a neighbouring cell may offer a stronger signal while already carrying heavy traffic. Measurement events provide context: A3 reports a neighbour becoming better by a configured offset; A5 combines a weak serving cell with a stronger neighbour; B2 concerns an inter-RAT neighbour. AI can combine these reports with demand and fault forecasts to recommend mobility settings or load-balancing actions. The outcome to verify is fewer interrupted sessions across both cells. A1–A5 and B2 are reporting conditions, not handover commands. [14]
Shared compute opens a separate commercial opportunity
McKinsey’s February 2026 brief estimates a $35–70 billion GPU-as-a-service market by 2030, excluding hyperscalers. Telcos can pursue that opportunity using their power, property, fibre and operating capabilities. This is the wider addressable market for GPU services; the share captured through RAN infrastructure depends on workload demand and deployment economics. [22]
AI and RAN makes one route concrete: share compute while reserving the resources and resilience needed by radio functions. SoftBank’s AITRAS work demonstrates coexistence and orchestration with RAN priority. For external customers, the offer can be GPU capacity, a managed inference endpoint or a complete application, each carrying different delivery obligations and margins. [13, 15]
Singtel RE:AI illustrates the sovereign AI services business. Enterprises can access models hosted on RE:AI GPUs or bring their own models, with Paragon coordinating infrastructure and services. Data residency, access control and governance make local hosting commercially relevant. This example supports the service proposition; SoftBank provides the direct evidence for shared RAN computing. [25]
Infrastructure placement should follow demand. Data centres support large GPU pools; aggregation facilities can pool inference demand near customers; selected radio sites can host compact workloads. The investment gate is contracted demand, full delivered cost and performance isolation after radio reservations. Higher utilisation matters when it improves the combined business case.
Why robotics gives edge AI a stronger commercial case
Earlier mobile edge computing investments struggled to attract the demand and ecosystem expected of them. Analysys Mason’s September 2026 research describes an infrastructure-led approach whose narrow latency benefits were difficult to monetise. AI brings more concrete workloads, stronger tooling and a reason to combine local computing with assured connectivity. [26]
Robotics makes that proposition tangible. A moving robot has changing compute needs, a finite battery and a task that depends on consistent communication. My view is that telcos are particularly well placed to deliver the managed connectivity and inference layer for distributed robot fleets. They can combine coverage, mobility, nearby compute and service assurance in one operating proposition.
SoftBank and Ericsson’s February 2026 proof of concept demonstrated dynamic offloading between a robot and an AI-RAN edge platform, coordinated with network slicing and priority controls. It showed why workload placement and network performance need to be managed together. [23]
The commercial offer can combine connectivity, reserved compute and inference consumption under an application-level service commitment. SoftBank’s May announcement of its AI Data Center GPU Cloud included Inference as a Service, with beta availability from May and commercial launch scheduled for October 2026. Its stated direction is integration with AI-RAN. [24]
The architecture will often be hybrid: onboard processing for immediate functions, nearby inference for demanding tasks and regional resources for broader coordination. Metro-edge facilities can pool demand across several sites. Smart-city applications offer another example, with roadside detection feeding coordination across junctions. Start with the location and application where the customer benefits from this arrangement. [26]
Smaller and specialised models expand deployment choices
Small language models, open-weight models and task-specific decision models expand the choices for local inference. An operator can select a deployable model for the task, tune it to the domain and place it on suitable edge hardware. Microsoft’s Phi family, for example, supports cloud, edge and on-device deployment. [27]
Microsoft Decision 1 illustrates the economics of specialised decisions: Microsoft quotes $0.042 per million input tokens, with output tokens free, and approximately 35 times lower median latency than GPT-6 Sol in its structured-decision comparison. Routing, classification and workflow selection are practical targets for this approach. [16]
Commercial success should be measured in completed customer tasks and service contribution. Test the complete application under peak demand, including access, transport, inference and execution, against the customer’s performance commitment.
How operators should prioritise and coordinate investment
Priorities should follow local value and deployment readiness. The assessment below is qualitative: each investment advances when the operator can demonstrate the next business result.
| Opportunity | Technical evidence | Next investment gate |
|---|---|---|
| Site energy | Production examples | Scale after metered savings and service validation. |
| Radio capacity | Live trials | Target congestion where an upgrade or sale can change. |
| Cell coordination | Mature controls; AI varies | Prove fewer interruptions across a cell cluster. |
| Assurance | Bounded production | Expand proven workflows with verification and rollback. |
| Shared RAN and GPU | Platform demonstrations | Prove isolation, full cost and contracted compute demand. |
| Enterprise edge AI | Established edge; AI varies | Deploy against a paid, location-sensitive requirement. |
| Public RAN shared AI | Emerging integration | Pilot a named workload before broad rollout. |
A network ontology and harness coordinate the decisions
At a station, an energy controller may propose sleeping a carrier just as a crowd arrives, a neighbour fails and an AI tenant requests compute. A network ontology connects resources with services, customers, products, SLAs, queues and field operations. The network harness uses that context to apply policies, permissions and FinOps, evaluate actions, execute through supported controls, verify outcomes and roll back when needed. This is the architecture I see as essential for coordinated autonomy. TM Forum’s intent work provides a foundation for shared semantics. [18]
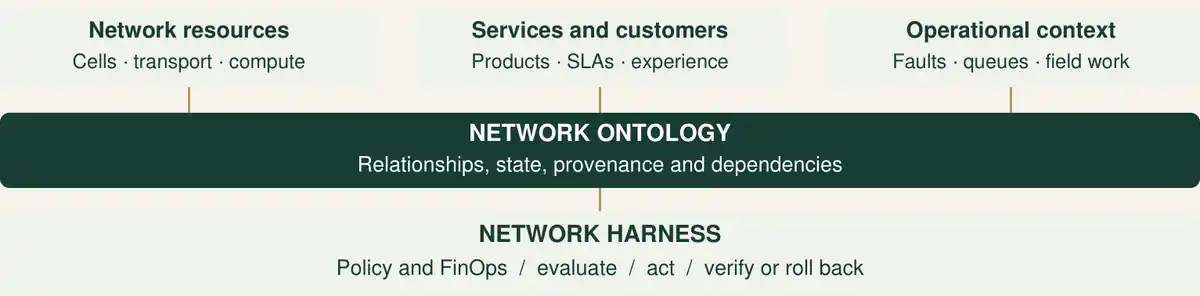
The harness reconciles energy, capacity, resilience and tenant commitments before action. FinOps supplies cost and budget context; operating policies protect service quality. Faster radio loops retain their engineered timing.
For each opportunity, establish a baseline and an owner. Combine verified cash savings, the present value of a specific capex deferral and incremental service contribution, then subtract build and operating costs. Track customer experience until its commercial effect is demonstrated, and avoid counting freed capacity twice. Expand authority as results become repeatable.
Sources and notes
Publications and product information checked through 28 October 2026. Operator and vendor results are reported findings. The value tests, prioritisation and proposed network harness are the author’s synthesis.
- Dell’Oro Group, Worldwide Telecom Capex to Decline in 2026. 2 April 2026. Carrier revenue outlook of approximately 2% CAGR.
- MTN Consulting, Global Telco Market Tracker, 2Q26. 11 September 2026. 145 operators; $304.5bn annualised capex through Q2 2026.
- Connect Europe / Analysys Mason, State of Digital Communications 2026. Figures include 2024 ARPU, capex and edge footprint; not current-year global outcomes.
- Vodafone, Annual Report 2026, printed p.232. €38.604bn gross debt at 31 March 2026; definition excludes lease and collateral liabilities.
- GSMA Intelligence, Green networks: part of the fabric, but still not everywhere. 7 August 2025. RAN energy boundary includes site infrastructure and backhaul.
- Virgin Media O2, O2 and Nokia deploy AI technology to improve 5G network performance in UK first. 26 October 2026. Paddington live trial.
- Deutsche Telekom, MINDR / RAN Guardian announcement. 25 February 2026. Production workflow and remediation results, not whole-network cost savings.
- AI-RAN Alliance, Working-group definitions: AI-for-RAN, AI-and-RAN and AI-on-RAN. Accessed 27 October 2026.
- Ericsson / TDC NET, Level 4 autonomy verification announcement. 19 June 2025. Defined energy scenario; approximately 800 MWh saved in 2024.
- Ericsson / SoftBank, AI-in-RAN trial on a 5G commercial network. 20 August 2026. Average gains distinguished from reported maxima.
- Ericsson / Optus, AI model for accurate 5G standalone coverage prediction. 5 March 2026. Accuracy result does not quantify handover or revenue uplift.
- GSMA Intelligence, Nearly a fifth of 5G users are dissatisfied with their 5G experience. May 2025. Survey across 12 markets; speed and coverage lead the reasons.
- SoftBank, AITRAS demonstration update. 16 July 2026. One-server cell and simultaneous workload demonstration.
- ETSI / 3GPP, TS 38.331 V16.20.0, section 5.5.4. July 2025. NR radio-resource-control measurement-reporting events; event descriptions are simplified.
- SoftBank, AITRAS orchestration research update. 4 March 2026. RAN priority, internal workloads and external AI resource allocation.
- Microsoft, Microsoft Decision 1 announcement. 9 October 2026. Vendor price and median-latency comparison for structured decisions.
- AI-RAN Alliance WG1, State-of-the-Art AI/ML Applications for Improvements in RAN Performance. Technical scope for the topology and use-case taxonomy.
- TM Forum, IG1358 Intent-Based Operation User Guide v1.2.0. 31 March 2026. Intent vocabulary and semantics; not a complete network-harness specification.
- MTN Consulting, Telco Opex Analyzer 2016–23. 16 January 2025. 32-operator sample; 2023 network share of opex includes depreciation and amortisation, alongside operations, leasing and utilities.
- GSMA, 5G-era Mobile Network Cost Evolution, sections 3.1 and 4.2. 28 August 2019. Historical model: 2013–2018 baseline and 2021–2025 scenarios. RAN infrastructure is 45–50% of network TCO; energy is a separate cost category. Model excludes spectrum and OSS/BSS.
- Vodafone, Annual Report 2026, printed p.157, note 5. Bond interest expense: €1.418bn in FY26 versus €1.301bn in FY25. Financing expense is distinct from network operating expenditure.
- McKinsey, Issue brief: AI infrastructure. 27 February 2026. GPUaaS addressable market of $35–70bn by 2030, excluding hyperscalers.
- SoftBank and Ericsson, Physical AI demonstration. 27 February 2026. Dynamic inference offloading between robots and AI-RAN MEC, with differentiated connectivity.
- SoftBank, AI Data Center GPU Cloud announcement. 25 May 2026. Beta began in May; commercial launch scheduled for October 2026. Includes Inference as a Service.
- Singtel RE:AI, Model as a Service. Open-weight models on RE:AI GPUs, bring your own models and Paragon orchestration. Product information accessed 28 October 2026.
- Analysys Mason, Edge AI: why telecoms operators should look again at edge computing. 17 September 2026. MEC demand, AI workloads and metro-edge positioning.
- Microsoft, Phi open model family. Small models supporting cloud, edge and on-device deployment. Product information accessed 28 October 2026.
Personal views, not those of my employer.